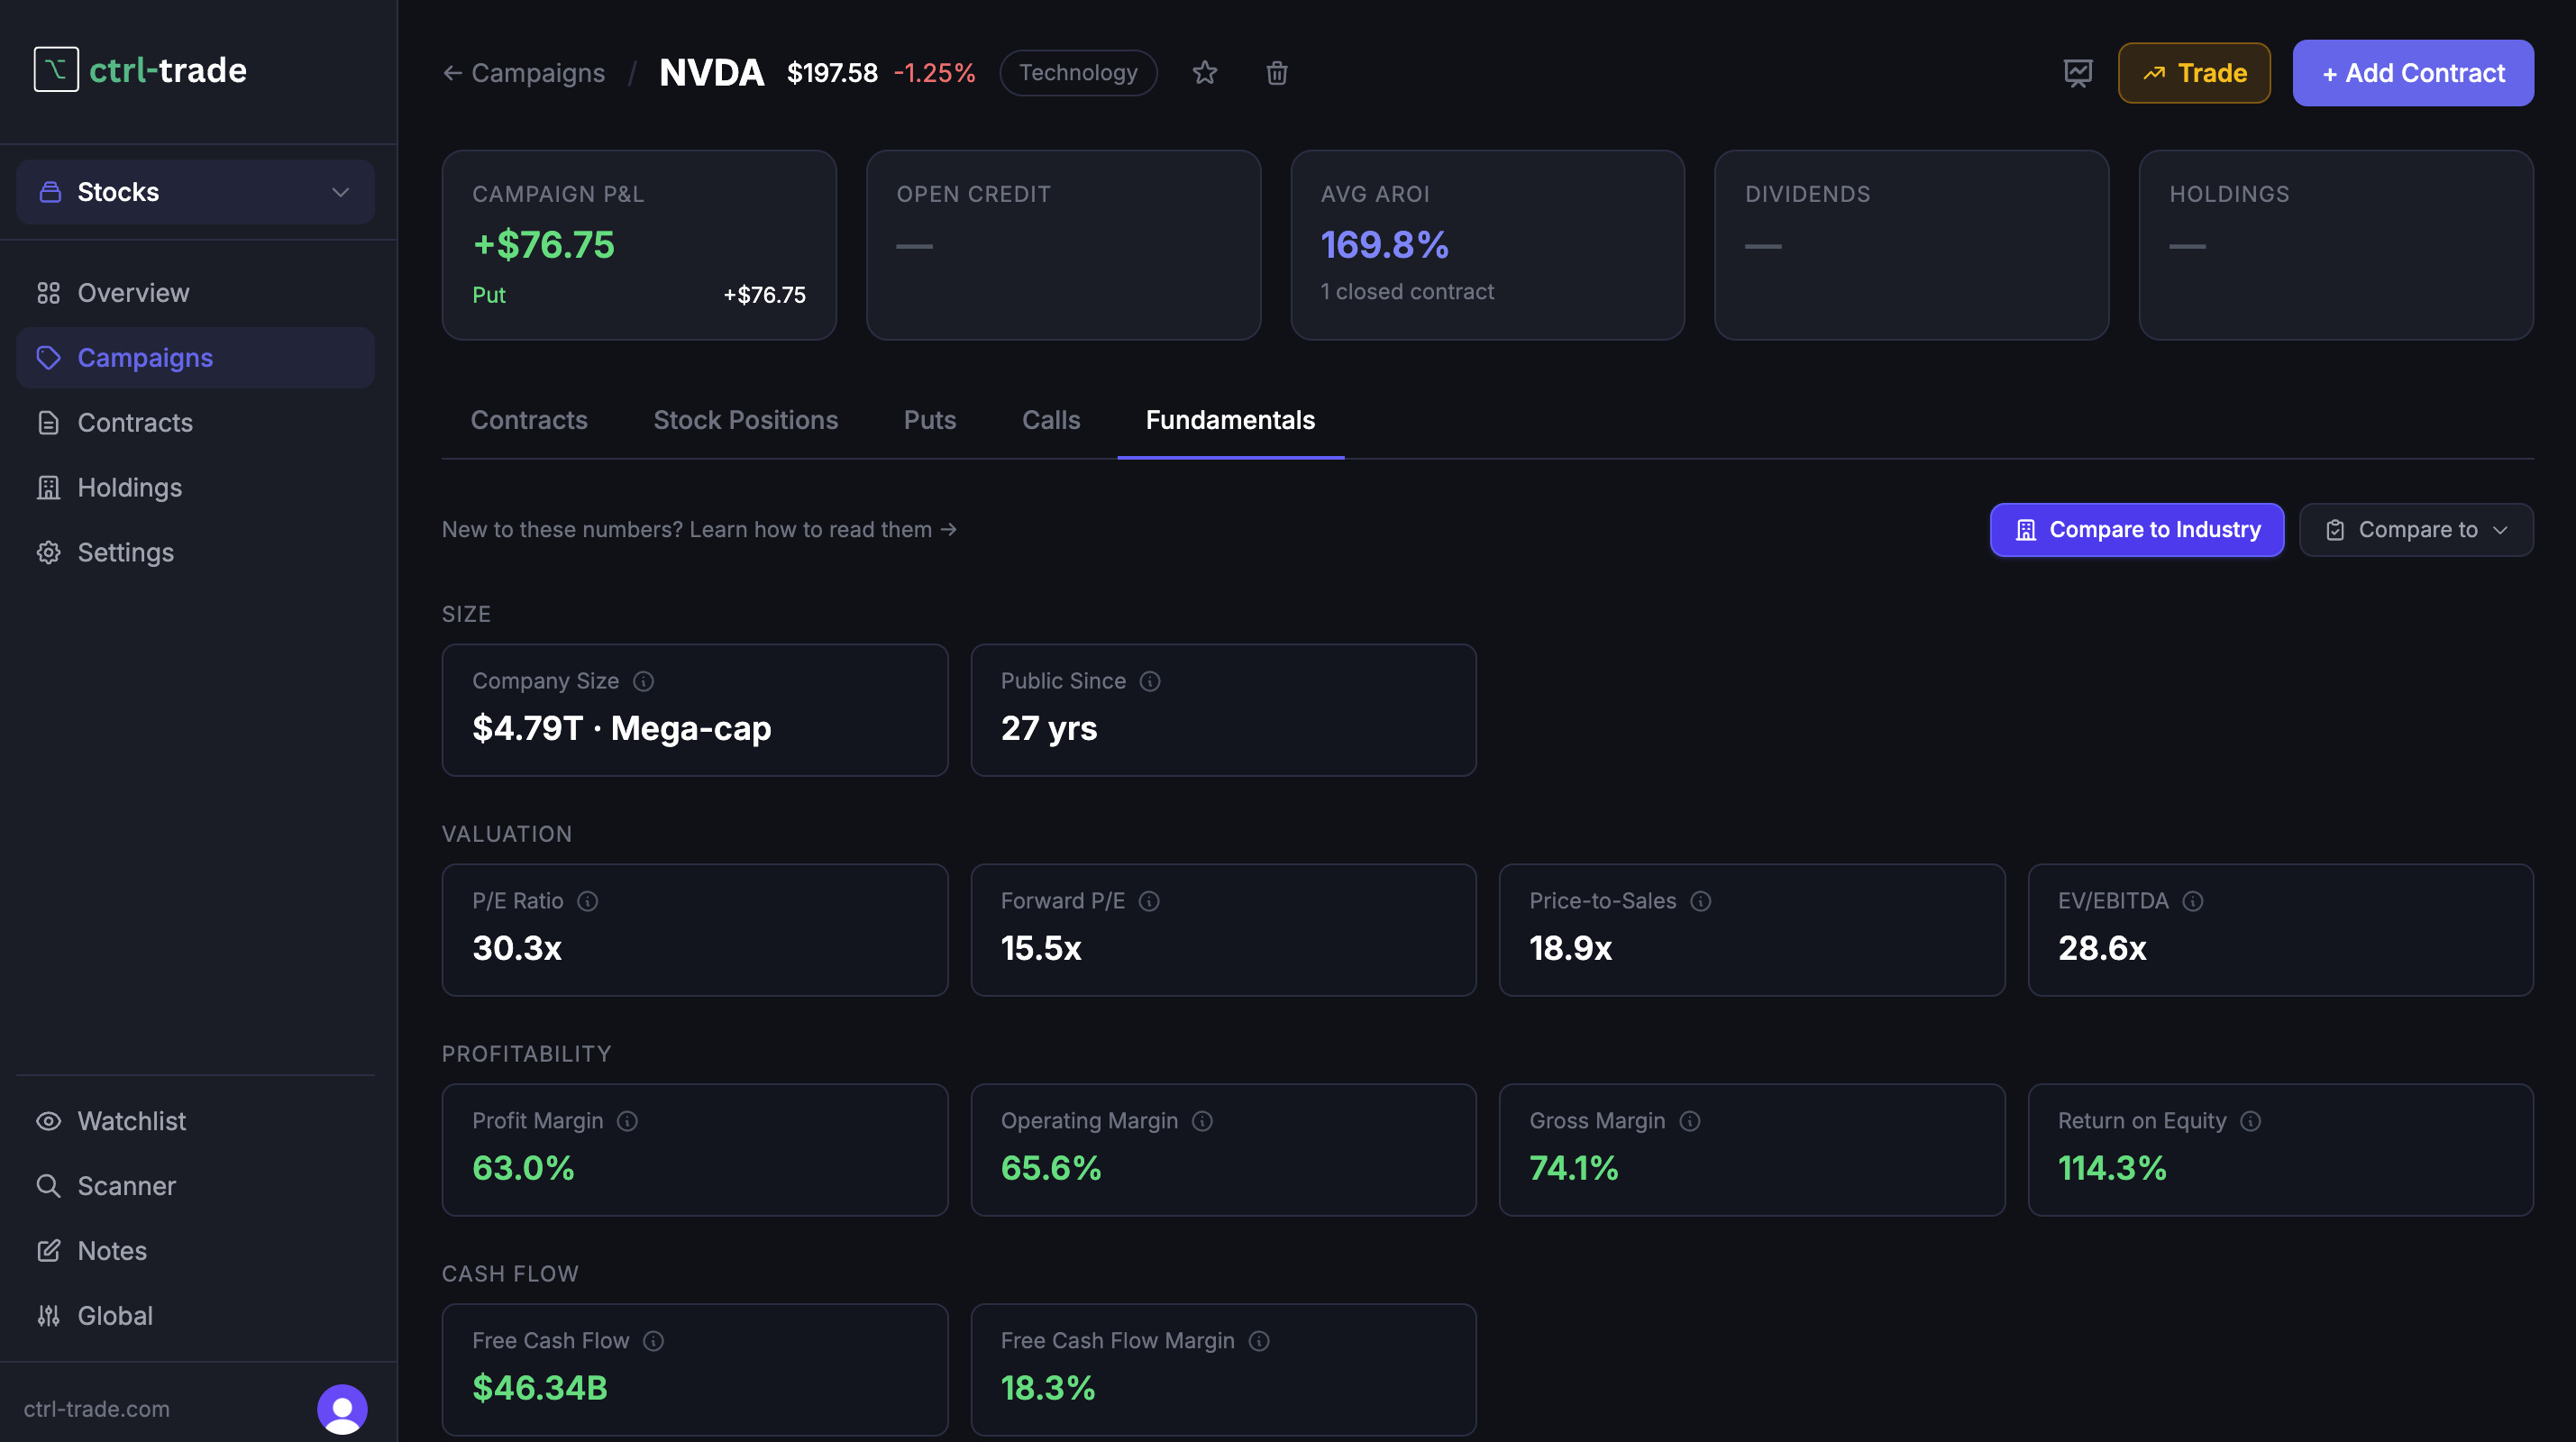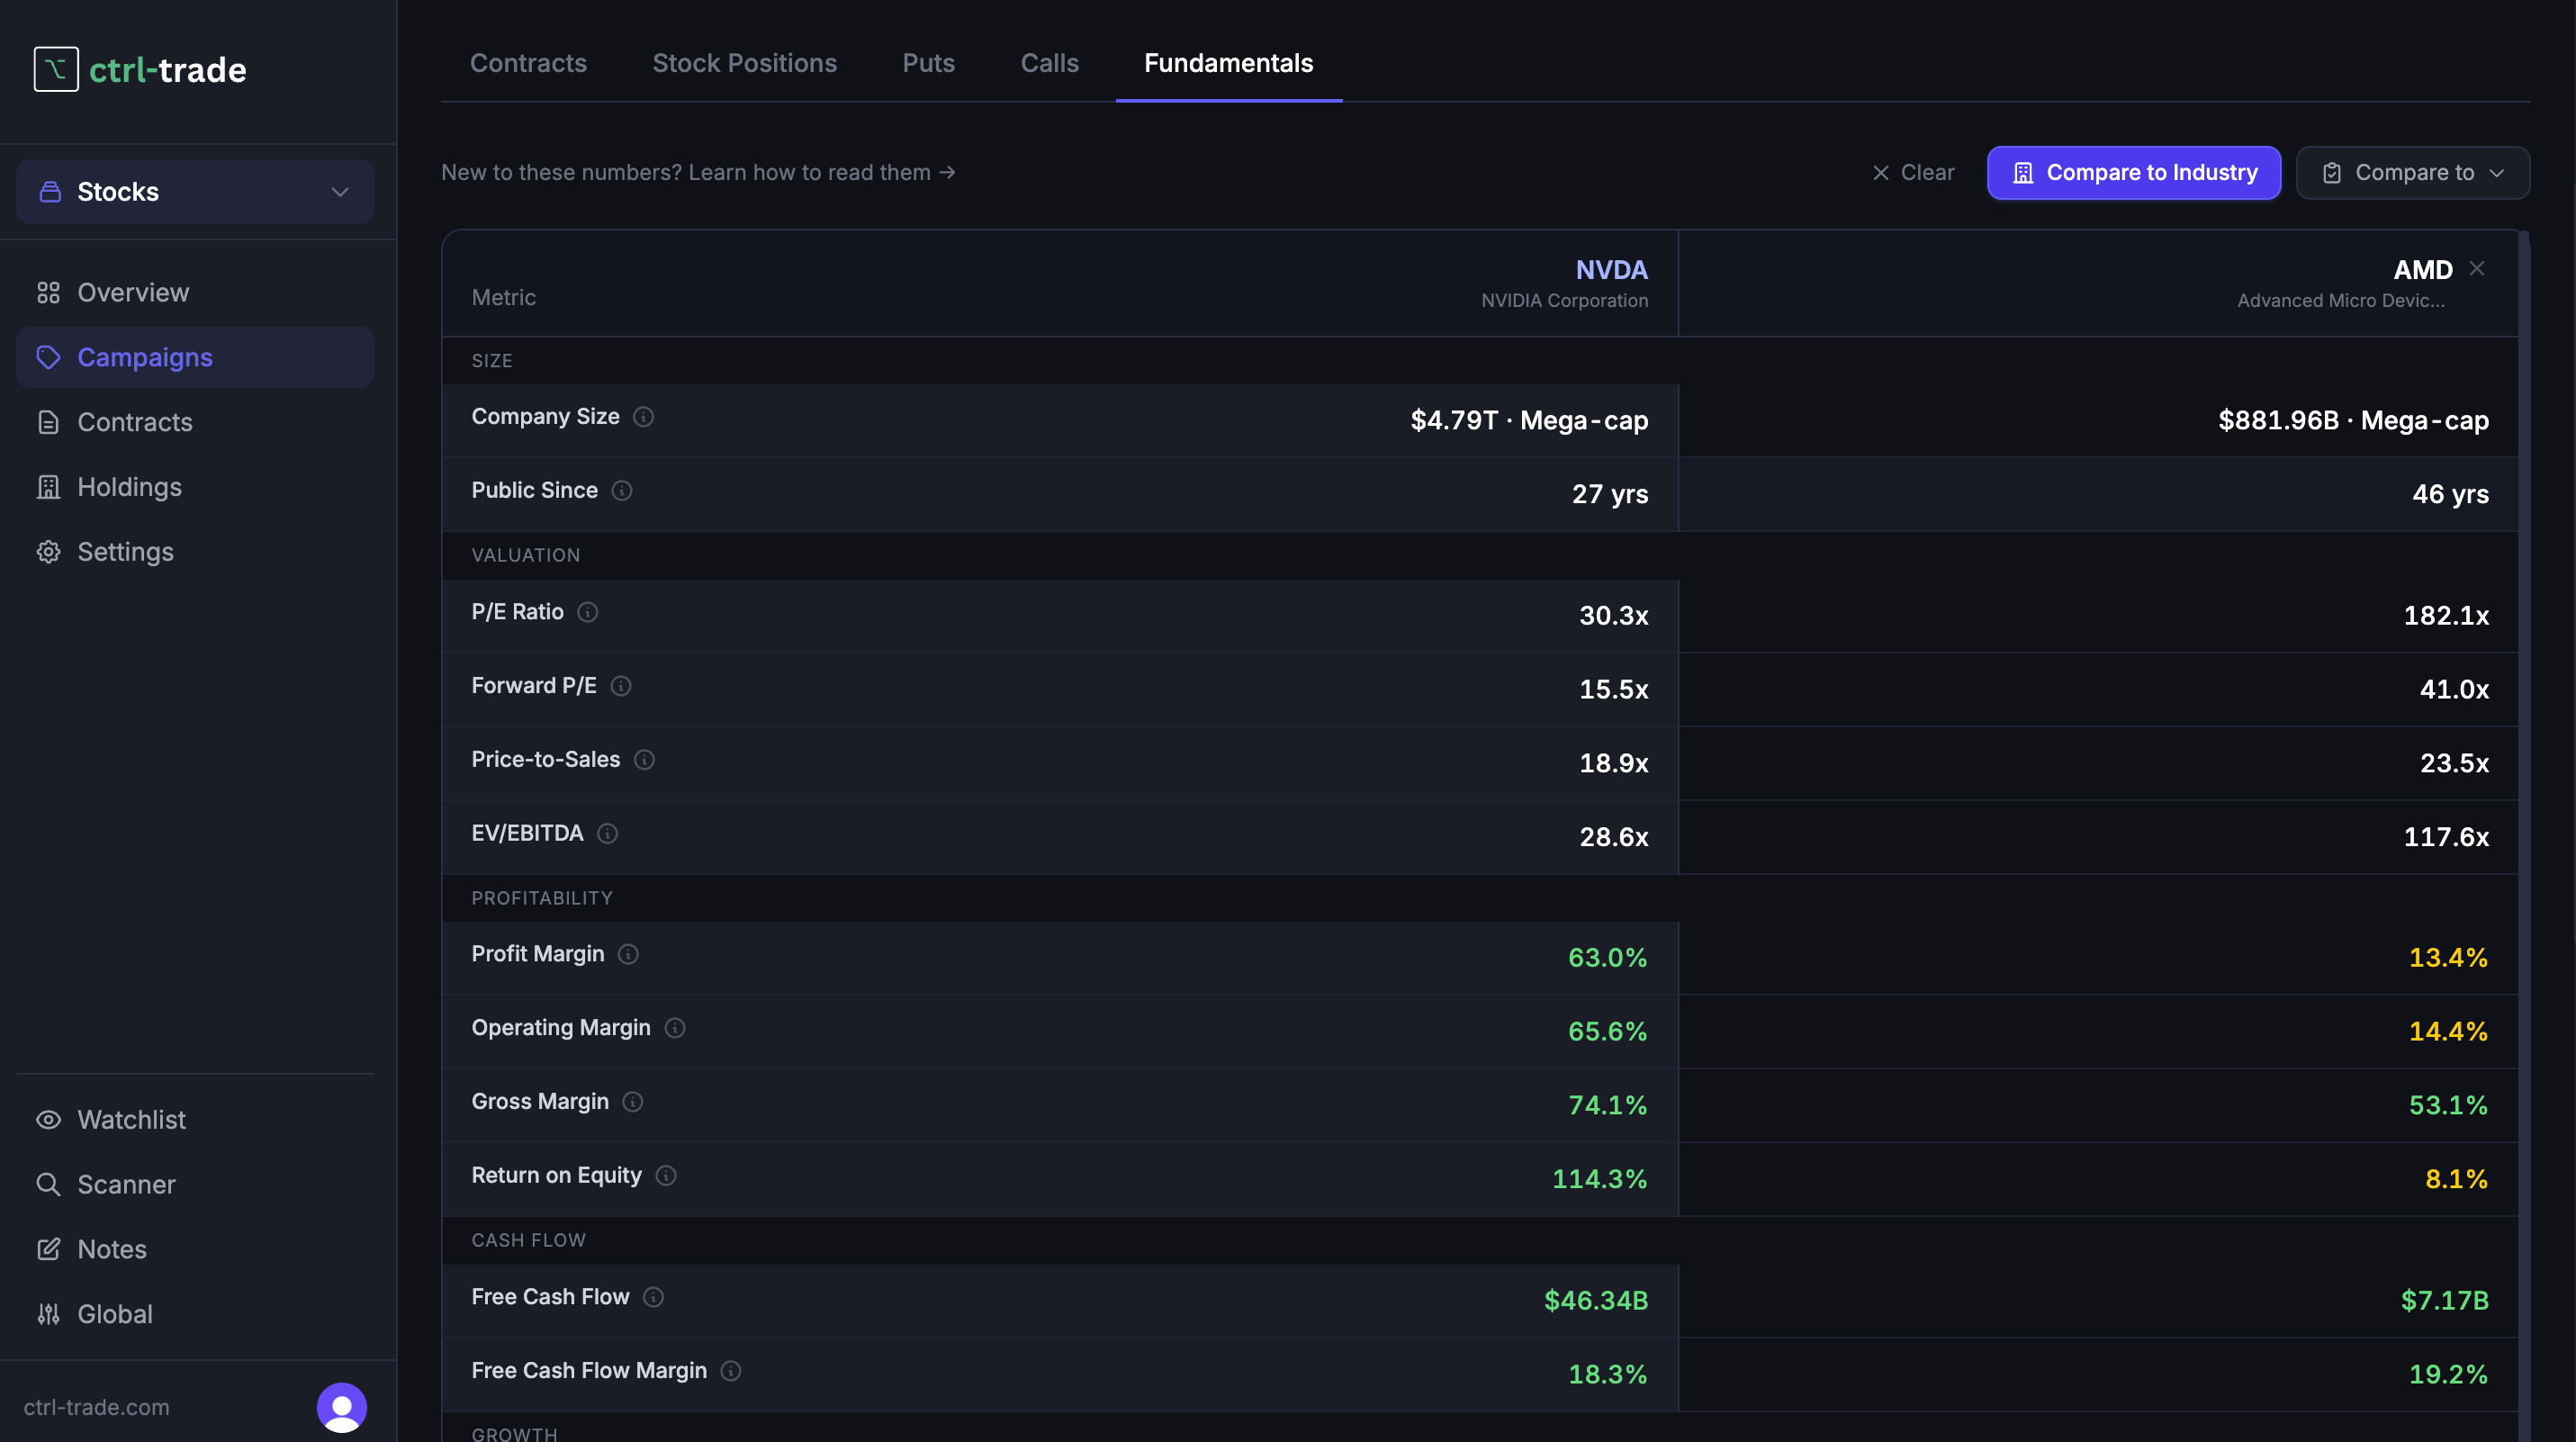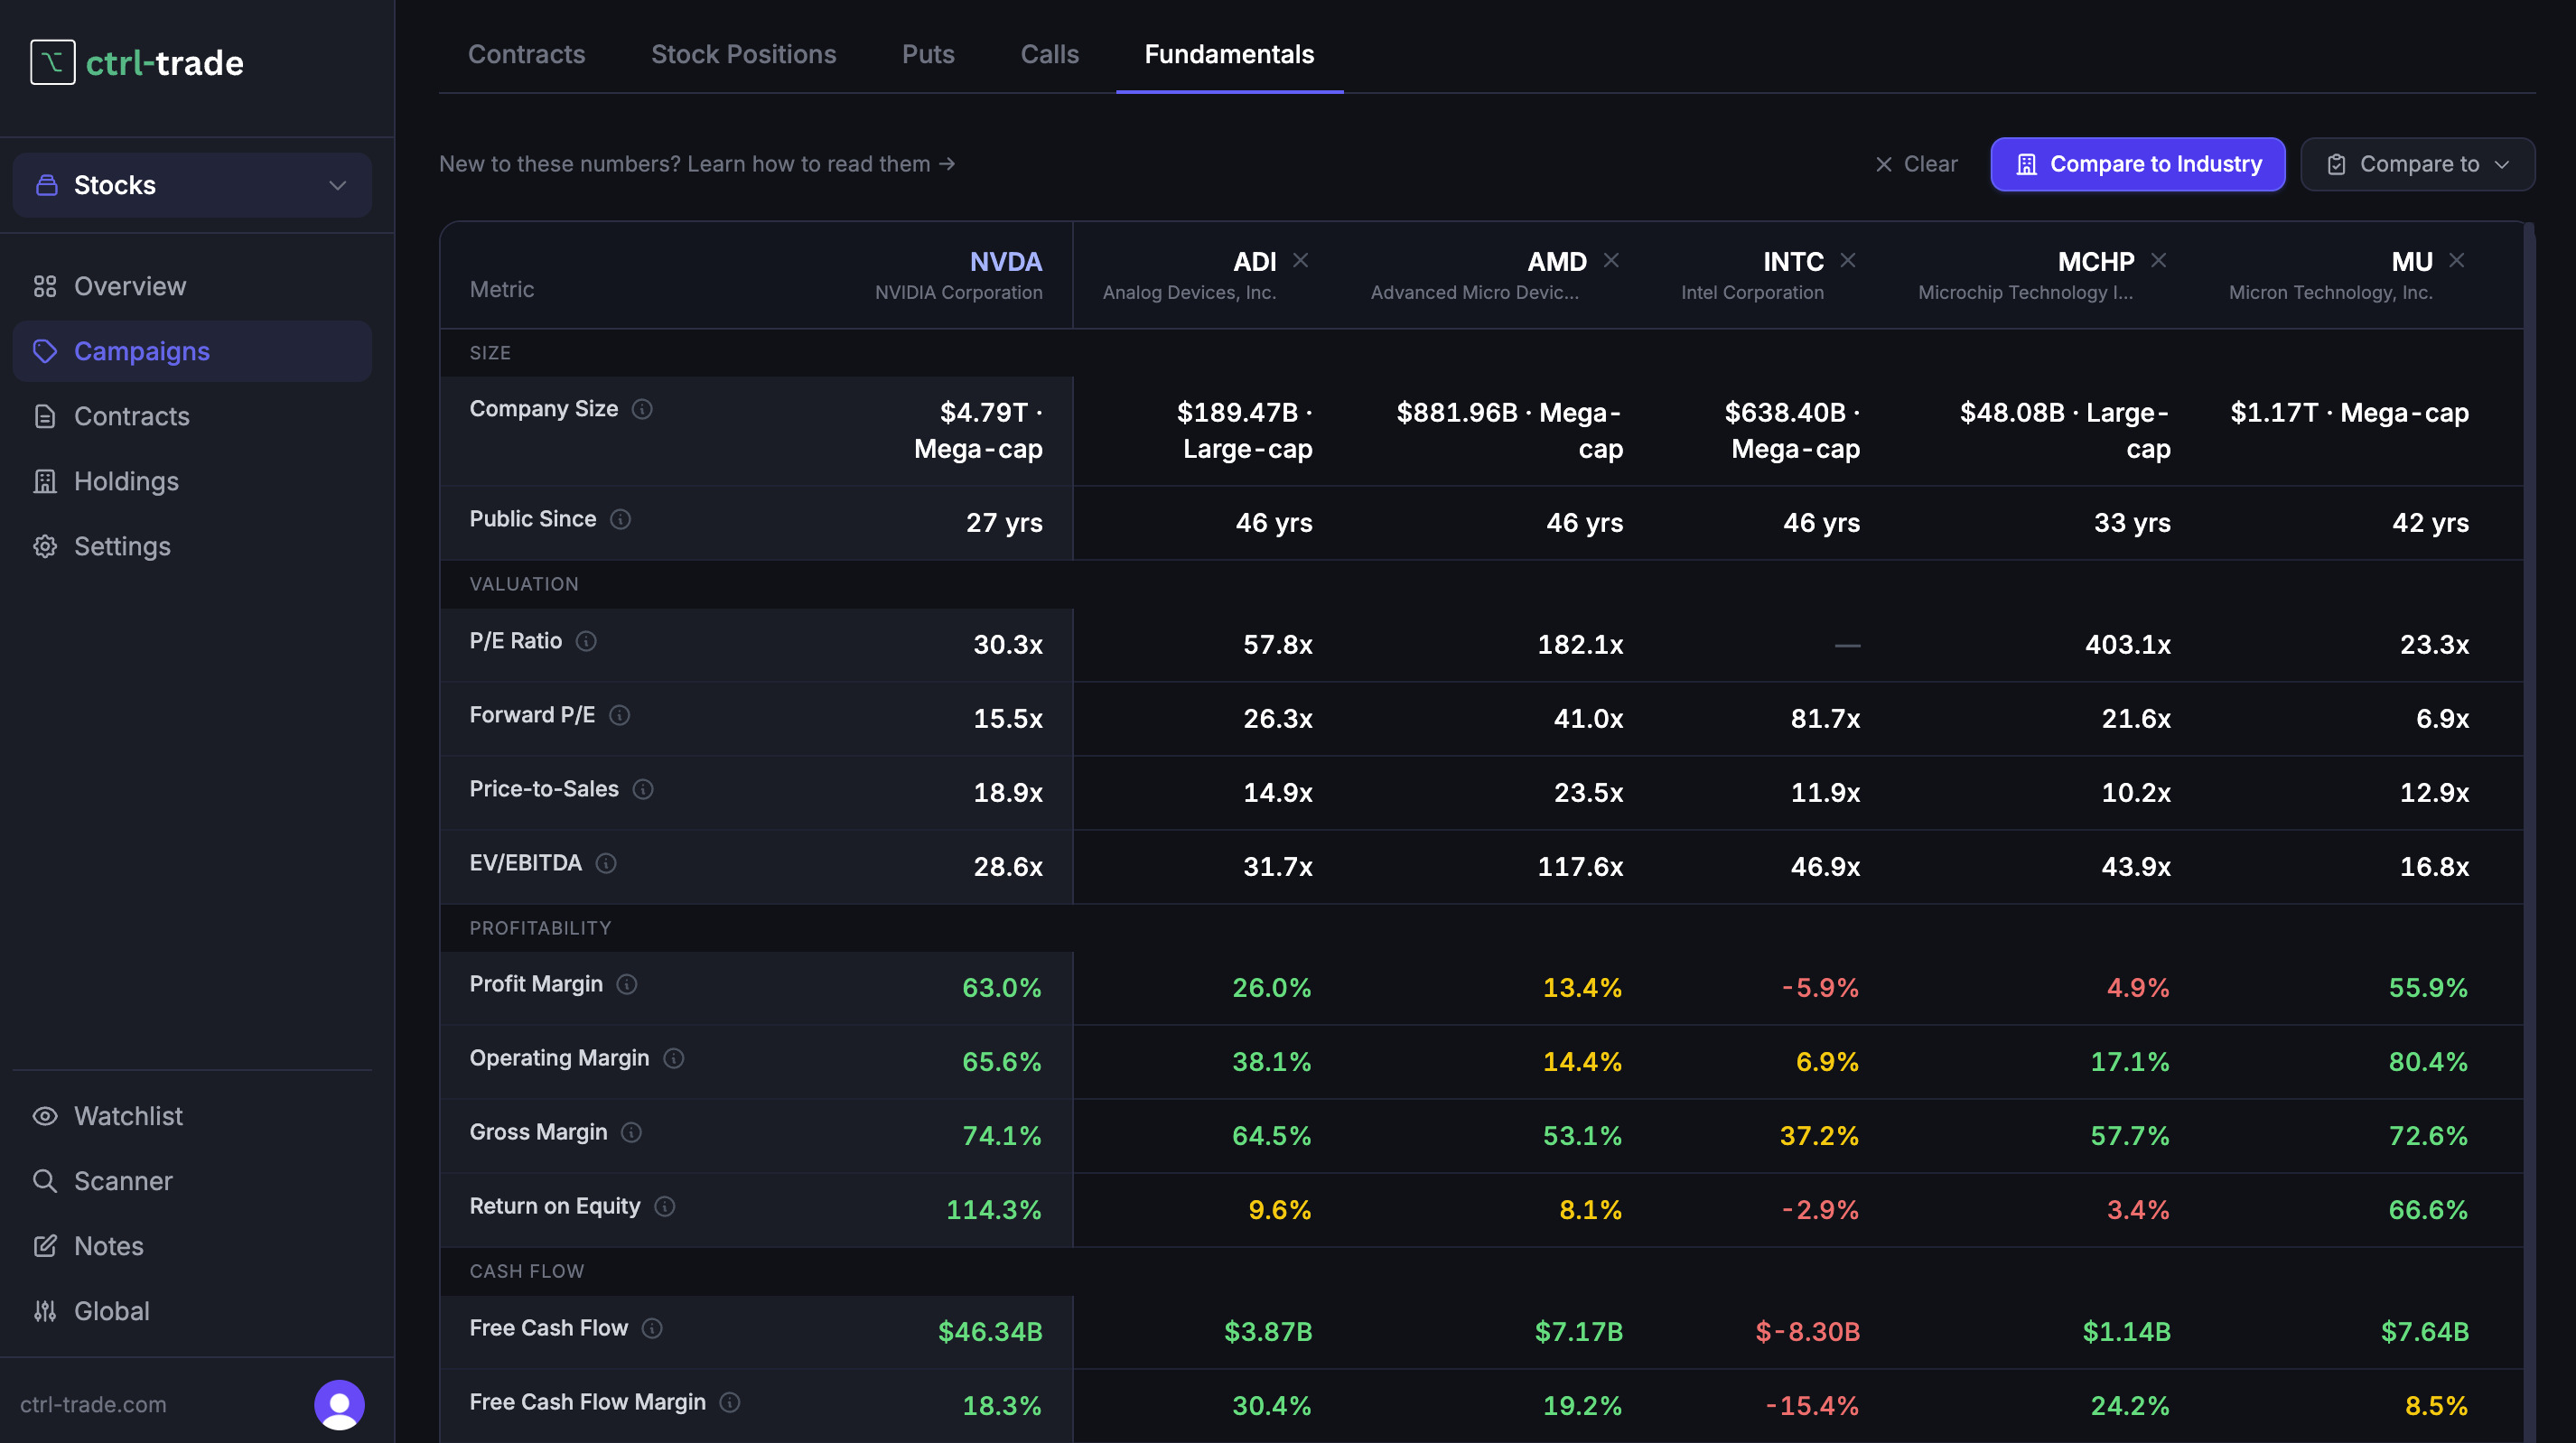
NVIDIA Corporation


NVIDIA trades at 32.0x earnings while growing earnings 214.5%, a price that looks reasonable for that pace (PEG ≈ 0.1). It runs lean, turning a 74.1% gross margin into a 63.0% bottom line, and with earnings outpacing revenue those margins are expanding. Its 114.3% return on equity looks spectacular, but a figure that high usually reflects heavy buybacks shrinking the equity base — a prompt to dig deeper rather than proof of efficiency. Looking ahead, analysts expect profits to rise, with the forward P/E (16.2x) below the trailing.
Company Size
How large is this company relative to the overall market?
Company Size
$5.06T · Mega-cap
The total market value of all shares outstanding. Mega-cap (>$200B) are the world's largest companies. Large-cap ($10–200B) are well-established. Mid-cap ($2–10B) are growing businesses.
Valuation
Is this stock priced cheaply or expensively relative to its earnings and revenue?
P/E Ratio
32.0x
Price-to-Earnings. For every $1 the company earned in the past year, you're paying this many dollars per share. Lower can mean a better deal, but fast-growing companies often trade at higher P/E ratios.
Forward P/E
16.2x
Same as P/E, but based on next year's expected earnings. A Forward P/E lower than the current P/E suggests analysts expect profits to grow.
Price-to-Sales
20.0x
How much you're paying for each $1 of the company's revenue. Useful when a company isn't yet profitable. Below 2x is generally low; above 10x is considered expensive.
Profitability
How efficiently does the company turn revenue into profit?
Profit Margin
63.0%
Of every $1 in sales, this is how many cents the company keeps as profit after all costs. A 20% margin means $0.20 profit per $1 sold. Higher is better.
Gross Margin
74.1%
Of every $1 in sales, how much is left after paying for the product or service itself — before other expenses like salaries and rent. Software companies often reach 70–80%; retailers are typically 20–30%.
Return on Equity
114.3%
For every $1 shareholders have invested, this is how much profit the company generates. Above 15% is generally considered strong and efficient use of capital.
Growth
Is the business expanding — or contracting?
Revenue Growth
85.2%
How much the company's total sales grew compared to the same period last year. Positive means the business is expanding. Negative means it's shrinking.
Earnings Growth
214.5%
How much the company's profits changed year-over-year. Strong, consistent earnings growth is one of the most watched signals by investors.
Financial Health
Can the company handle its debts and short-term obligations?
Debt-to-Equity
0.07x
How much debt the company carries relative to what shareholders own. Below 1.0 means the company has more equity than debt. Above 2.0 starts to look risky for most industries.
Current Ratio
3.44x
Can the company pay all its short-term bills in the next 12 months? Above 1.0 means yes — it has more short-term assets than debts. Below 1.0 can be a warning sign.
Dividends
Does the company pay shareholders regular cash income?
Dividend Yield
0.0%
The annual cash payment to shareholders as a % of the share price. A 3% yield means you'd earn $3 per year for every $100 invested, just for holding the stock. A value of 0% means no dividend is paid.
Risk & Volatility
How much does this stock move relative to the overall market?
Volatility (Beta)
2.21x
How much the stock tends to move relative to the overall market. 1.0 = moves in line with the market. Above 1.0 = more volatile (higher potential gain and loss). Below 1.0 = calmer than the market.
Analyst View
What do professional Wall Street analysts say about this stock?
Analyst Consensus
Strong Buy (58 analysts)
The average recommendation from professional Wall Street analysts who research this company. Ranges from Strong Buy to Strong Sell.
Analyst Target Price
$302.83
+45.0%The average 12-month price target set by analysts.
These figures are reported data shown for educational purposes — not a recommendation to buy or sell any security. Data may be delayed; always verify before acting.
See the whole picture inside Ctrl-Trade
This page is a free preview. Inside the app, the full fundamentals overview sits right next to your positions — and you can run a complete comparison against any stock, or an entire industry, in a single view.
Not yet public — join the waitlist for early access. No spam.