Is 'Just Buy an Index Fund' Really Enough? 20 Years of Backtested Data

June 8, 2026
If you’ve ever asked the internet how to invest for the long run, you’ve heard the same answer many times: “Just buy a well-diversified index fund and you’ll be fine.” It’s repeated so often it’s become gospel. And to be fair, it’s not bad advice — it’s certainly better than picking stocks on a hunch.
But in my opinion this advice doesn’t give the investor the full picture and a realistic expectation of the journey. It only considers the compounding power, but doesn’t emphasize enough the emotional process. Would you be ok through a 55% drawdown? Are you ready to watch three and a half years go by before your portfolio goes back to where it started? The advice is usually given without enough numbers attached to it — which, for something as important as where you park your life savings, is surprising.
So I did what any good programmer would do: I tested it against the alternatives :)
And here’s the thing — the strategies I tested aren’t random ideas I made up. Each one is the real philosophy of an investing legend. “Just buy the whole market and never sell” is John Bogle, the man who gave the world passively-managed index funds. “Keep most of it in stocks with a small bond cushion” is Warren Buffett, who famously told his own estate to sit in 90% S&P 500 and 10% bonds. And the “risk parity approach across balanced assets” resembles Ray Dalio’s all-weather portfolio. Three titans, three very different answers to the same question.
How I Tested It
Before the results, the rules of the game — because a backtest is only as honest as its methodology.
- Period: 2006–2026, roughly 20 years. Crucially, this window contains three global crises: the 2008 Global Financial Crisis, the 2020 COVID crash, and the 2022 rate-hike bear market.
- Assets: SPY (S&P 500), TLT (20-year Treasuries), DBC (broad commodities), and GLD (gold).
- Starting capital: $10,000, dividends reinvested (using adjusted close).
- Rebalancing: Annual, every January — plus immediate rebalancing on regime switches for the trend-filtered strategy.
- Data & tooling: yfinance daily data, simulated in Python. No transaction costs or taxes modeled (more on why that matters in the caveats).
Five strategies, one fair fight. Here’s how they finished.
The Master Results
A few columns do all the heavy lifting in the table below, and if you’re new to investing they can be kinda intimidating. So here’s a plain English explanation of the metrics first — once these click, the whole table tells a story:
- CAGR (Compound Annual Growth Rate) — the smoothed average return per year. A +10% CAGR means your money grew as if it earned a steady 10% every year, ignoring the bumps along the way. It’s the single number people usually mean by “return.”
- $10K became — I probably don’t need to explain this :) It’s just CAGR made tangible.
- Volatility — how much the value bounces around. High volatility is a wild ride (big swings up and down); low volatility is a smooth one. It’s a measure of stress, not return.
- Sharpe ratio — return per unit of risk. It takes your return and divides it by how much volatility you stomached to earn it. This is what “risk-adjusted” means: two strategies can post the same return, but the one that got there with less white-knuckling earns the higher Sharpe. Roughly speaking, above 0.7 is good and above 0.9 is excellent. If you only read one column, read this one.
- Max DD (maximum drawdown) — the worst peak-to-trough fall along the way: how far the portfolio dropped from a high before recovering. A -55% Max DD means that at the low point, you were down more than half your money.
- Recovery — how long (in days) it took to climb back to a previous high after that worst drop. 1,256d is about 3.4 years spent underwater, waiting just to break even.
| Strategy | Allocation | CAGR | $10K became | Volatility | Sharpe | Max DD | Recovery |
|---|---|---|---|---|---|---|---|
| 100% SPY | SPY only | +11.2% | $83,600 | 19.3% | 0.58 | -55.2% | 1,256d |
| 80/20 + TLT | 80% SPY / 20% TLT | +10.1% | $68,500 | 14.2% | 0.71 | -42.5% | 694d |
| Diversified | 50% SPY / 25% TLT / 15% DBC / 10% GLD | +8.6% | $52,100 | 10.5% | 0.82 | -32.0% | 575d |
| Equal Weight | 25% SPY / 25% TLT / 25% DBC / 25% GLD | +7.7% | $44,100 | 10.1% | 0.76 | -27.4% | 685d |
| EMA-50 filter ★ | Trend-switched ★ | +9.9% | $66,100 | 10.7% | 0.93 | -31.2% | 680d |
★ In the trend-filtered strategy, the allocation isn’t fixed: it switches between a risk-on and a risk-off mix, following the EMA-50 indicator. More on that in The Winning Formula below.
Here’s the trap: your eye jumps straight to that top row — 100% SPY, the highest CAGR and the fattest $10K-became number — and stops. But follow the Sharpe column instead and the ranking flips on its head. The strategy with the best raw return has the worst risk-adjusted score (0.58), while the trend filter has the best (0.93) despite ending with less money in the account. That gap between “most return” and “best return for the risk” is the entire point of this article — and it only really shows up when you look at how each strategy behaved inside the crashes, which is where we’re headed next.
What the Numbers Actually Say
1. Pure SPY wins on raw return — and loses on everything else. That +11.2% CAGR is the best of the bunch, no argument. But look at the price of admission: a -55% drawdown with a 3.4-year recovery. On paper that’s “just volatility.” In real life it’s watching half your net worth evaporate and then waiting until 2012 to feel whole again. The reason index-fund advice fails so many people isn’t that the math is wrong — it’s that almost nobody actually holds through a -55% hole. They sell at the bottom. The best strategy is worthless if you can’t stay in it.
2. The bond sleeve is insurance, not an engine. In normal times that 20% in bonds barely moves your return — it’s there to cushion the falls, not to drive the growth. Where it earns its keep is in a deflationary, flight-to-safety crash, and that’s down to duration — duration is simply how sensitive a bond is to interest-rate moves, and longer-dated bonds swing harder when rates change. TLT holds 20-year Treasuries, about as long-duration as it gets, which is exactly why it shines when it matters most: when markets panic and the Fed cuts rates, long Treasuries rally hard and partly offset the hit to your stocks (it softened the GFC drawdown to -42.5% vs SPY’s -55.2%).
3. Diversification has a real cost and a real benefit — there’s no free lunch. Equal Weight lost just -1.2% annualized through the GFC while SPY was bleeding -31.2%. Extraordinary protection. But it also trailed badly through the bull decade: +6.6% vs +16.0%. That gap is the premium you pay for the airbag. Diversification doesn’t make you more money — it changes when you make it, trading a chunk of upside for a much smoother ride. Whether that’s worth it depends entirely on whether you’d actually have held SPY through 2008.
4. The trend filter was the best risk-adjusted strategy I tested. This is the one that surprised me. First, the jargon: an EMA (exponential moving average) is just a line that tracks an asset’s average price over a recent window — here, the last 50 trading days — weighted toward the most recent days so it reacts faster than a plain average. The rule of thumb: when today’s price is above its 50-day EMA, the trend is generally up; when it’s below, generally down.
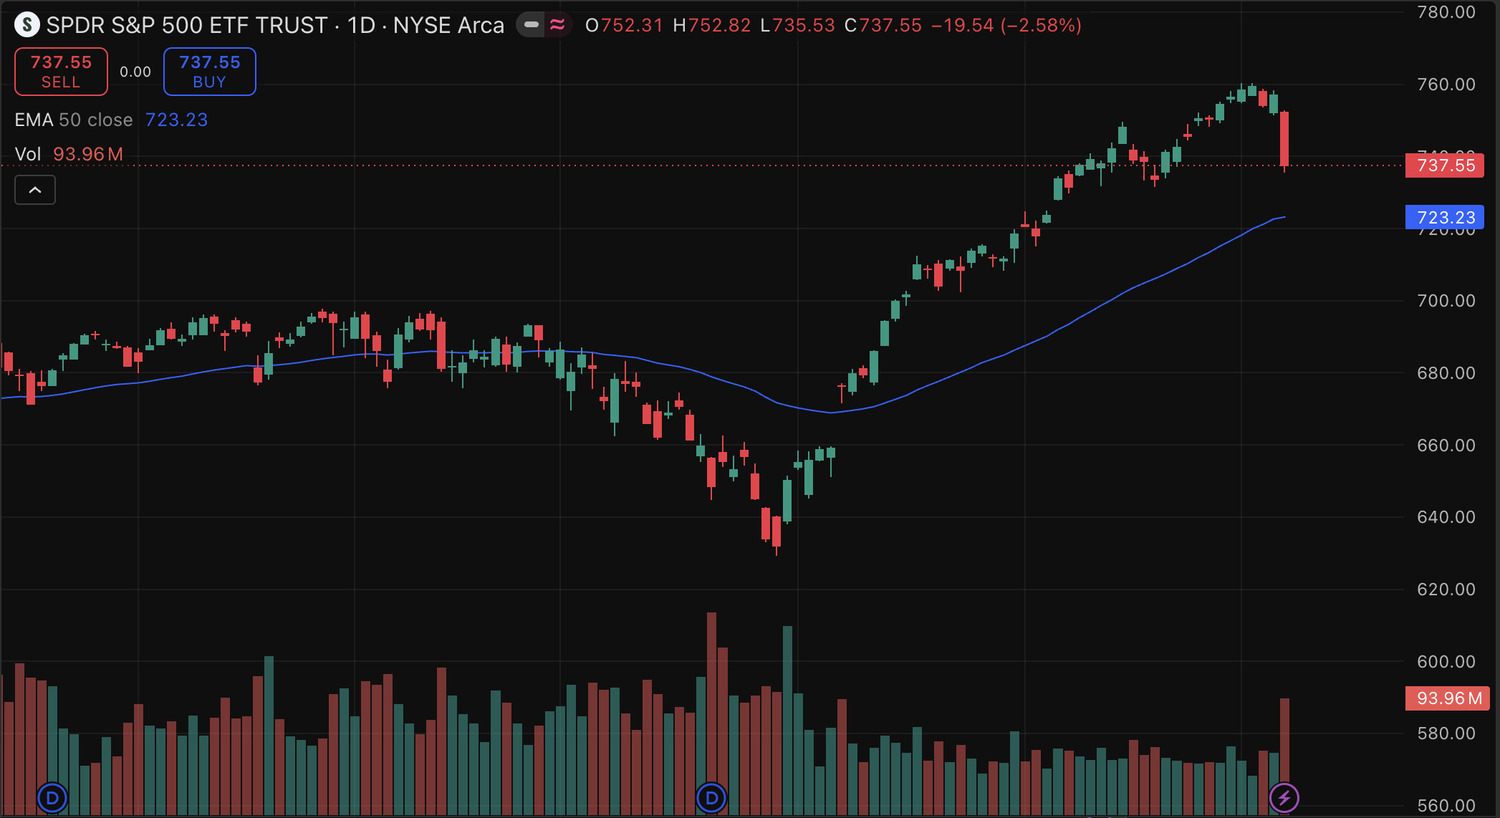
The 50-day EMA (the smooth line) versus SPY’s price: when price sits above it, the strategy plays offense; when it drops below, defense.
We use that as a regime switch — a simple “are we in good times or bad times right now?” signal that tells the portfolio when to play offense versus defense. Above the line, you hold a stock-heavy risk-on mix; below it, you flip to a defensive Treasury-and-gold mix (I lay out the exact weights and the reasoning in The Winning Formula below). The payoff:
- The best Sharpe ratio in the entire test (0.93) — the highest-quality return per unit of risk of anything I ran.
- Max drawdown nearly halved versus 100% SPY (-31% vs -55%), and meaningfully lower than even the static 80/20 (-31% vs -43%).
- CAGR within 0.2% of the static 80/20 baseline (+9.9% vs +10.1%) — almost none of the return was sacrificed.
- The best COVID-crash performance by a mile (+31.5%), because the filter flipped defensive on the way down and caught the V-shaped recovery early.
Read that again: nearly the same return as buy-and-hold-with-bonds, with half the pain. That’s not a small edge.
5. EMA-21 was too twitchy, EMA-200 too slow — 50 is where I landed (for now). I didn’t just assume 50 was the magic number; I tested the neighbors. The EMA-21 was too twitchy — 631 switches over 20 years, almost all of it noise, and the constant whipsaw quietly destroyed returns. The EMA-200 was the opposite problem: too slow to react, it got caught flat-footed by fast crashes like COVID. But I feel I need to dig deeper in the combinations here, and I’ll probably do it soon in another research-based blog post.
6. For the defensive sleeve, gold beats commodities. Swapping broad commodities (DBC) for gold (GLD) in the bear-regime mix lifted the Sharpe from 0.81 to 0.93 and meaningfully cut the drawdown. Gold is simply a more consistent crisis hedge — broad commodities carry too much cyclical, growth-sensitive baggage to be reliable when you most need protection.
The Winning Formula — How to Actually Run It
The signal — EMA-50 checked weekly. Everything hinges on a single check: is the S&P 500 trading above its 50-day EMA, or below it? Above means the trend is up — a bull regime (rising market), time to play offense. Below means the trend is down — a bear regime (falling market), time to play defense. Because the EMA is a slow-moving line, this isn’t a daily coin-flip: over 20 years it crossed roughly 18 times a year, and most of those were genuine turns rather than noise. You don’t forecast anything — you just read which side of the line the price is sitting on.
Bull regime → risk-on: 80% SPY / 20% TLT. When the trend is up, you want to be mostly in stocks soaking up the gains, with a modest Treasury cushion to soften the bumps. It’s essentially the Buffett 80/20 — and it’s the reason the strategy keeps pace with plain buy-and-hold through the good years.
Bear regime → risk-off: 20% SPY / 50% TLT / 30% GLD. This is the half that earns the strategy its edge. The moment SPY closes below its 50-day EMA, you slash stock exposure from 80% down to 20% and rotate the bulk into two time-tested crisis hedges: 50% long-duration Treasuries (TLT), which tend to rally as frightened money rushes to safety and rates fall, and 30% gold (GLD), a steadier store of value when confidence cracks. The token 20% left in stocks keeps you from missing a violent snap-back like the spring of 2020. This single rotation is what turned a -55% buy-and-hold drawdown into a survivable -31%.
The rebalancing — when you actually trade. Two triggers, and only two. First, routine housekeeping: rebalance back to your target weights once a year, every January, so a winning sleeve doesn’t quietly take over the portfolio. Second, and more important: rebalance immediately whenever the regime flips.
To put the two setups side by side:
- Risk-on (SPY above its 50-day EMA): 80% SPY / 20% TLT
- Risk-off (SPY below its 50-day EMA): 20% SPY / 50% TLT / 30% GLD
Result: Sharpe 0.93, CAGR 9.9%, max drawdown -31.2% — using only three ETFs and roughly 18 rebalances a year. Nearly the full return of buy-and-hold, with the drawdown of a far more conservative portfolio. That combination — keeping the upside while cutting the worst-case loss in half — is the closest thing to a genuine edge that showed up anywhere in this data.
The deeper lesson is the one the generic advice skips: the best strategy on paper is the one you can actually live through. A -31% drawdown is survivable. A -55% one, for most people, is not — they capitulate, and the math never gets a chance to work. Knowing your own metrics, and how a portfolio behaves in the trough, matters as much as the headline return — the same principle I wrote about for individual stocks in Understanding Stocks: The Key Metrics That Matter.
A Few Honest Caveats
Before you act on any of this, the fine print — kept short:
- Costs and taxes aren’t modeled. The trend filter rebalances roughly 18 times a year, and in the real world that means spreads, commissions, and possibly short-term taxes. The live edge will be smaller than the backtest — run it in a tax-sheltered account if you can.
- This is one 20-year sample. It covers three brutal crises, but the future is under no obligation to rhyme with the past. And the filter had one genuinely bad year — 2022 — when stocks and bonds fell together, the one scenario a stocks-and-Treasuries model simply can’t hedge.
- The S&P 500 is a stand-in, not a recommendation. I used SPY as the stock building block because it has the longest, cleanest data and backtests beautifully — not because it’s the only thing worth owning. Remember that 100% S&P 500 is still a bet on a single country (United States). A well-diversified core today can reach much wider in one fund: MSCI World holds large- and mid-cap stocks across 23 developed countries, and ACWI (the All-Country World Index) goes further still, adding emerging markets on top. Every major manager — Vanguard, BlackRock and the rest — offers them at rock-bottom cost, and every strategy in this post may work in a very similar way with a global index swapped in for SPY.
So — Who Wins?
Here’s my honest answer, and it isn’t a single winning portfolio.
Yes, 100% S&P 500 can absolutely be enough. It was the highest-returning strategy in the entire test, and if you genuinely have the stomach to watch your account fall by half and do nothing — no panic-selling, no flinching, just holding for years until it heals — it’s a phenomenal, beautifully simple way to build wealth. The catch isn’t the math, it’s the discipline to keep going through very difficult periods and avoid selling at the bottom.
The trend filter is better on paper — but “on paper” hides a cost. Nearly the same return with half the drawdown is a real edge, but it asks something of you: watch the signal, run those ~18 rebalances a year, and flip from offense to defense in the middle of a crash without second-guessing yourself. That takes discipline, attention, and a bit of skill — and if we’re honest, most people won’t keep it up year after year. A clever strategy you abandon halfway through is worse than a simple one you’ll actually stick to.
So the real question was never “is the index fund okay?” It’s which discomfort can you live with? — the painful drops of pure stocks, or the ongoing effort of active management. The best strategy on the spreadsheet means nothing if it isn’t the one you’ll still be running in ten years. In a sense, as a retail investor you will also be doing what professional investors mostly do: managing risk!
Know the numbers, know yourself, and pick the one you can actually hold to :)
Happy Investing,
Francesco
Software Developer & Options Trader
Creator of Ctrl-Trade. A software developer of 15+ years who brings a programmer’s discipline — clear rules, data and backtesting — to options trading, and writes about what he learns in plain English.