Directional vs Volatility Trading in Options

July 3, 2026

A while back I wrote about why, as an option seller, you start the game with a statistical edge. That post was about the basics — the who and the why. Now it’s time to level up and look at the way beginners and professionals think about options trading.
Here’s the idea the whole post hangs off. When you open an options position, you are betting mainly on two things:
- Direction — where the stock is going. Up, down, or nowhere in particular.
- Volatility — how much the stock is going to move, regardless of which way it goes.
Most beginners only ever think about the first one. But a lot of the real edge lives in the second — so let’s walk through both. And since both come down to how an option gets its price, that’s where we’ll start.
How an option actually gets its price
The premium you collect (or pay) isn’t pulled out of thin air. It comes from a small handful of factors:
- How far the stock is trading from your strike (the price your contract is built around)
- How much time is left until expiration
- How much the stock is expected to move — its volatility
- The risk-free rate
Decades ago these got tied together into a famous formula — the Black-Scholes-Merton model (BSM for short), the Nobel-winning backbone of modern options pricing. It deserves its own post, and now it has one — how options are actually priced. For today you only need to know it exists and that it turns those inputs into a fair theoretical price.
But here’s the part that matters for everything below. Look at that list again: almost every input is knowable. The stock price, the strike, the days left, the risk-free rate — you can look them all up right now. Volatility is the odd one out. Nobody knows how much a stock will move in the future. It has to be estimated — and an estimate is really just an opinion. Keep that in your back pocket, because it’s the seed of the whole volatility-trading idea.
One more useful lens: part of an option’s price is “real” (how far in-the-money it already is) and part is pure time-and-uncertainty. That second part quietly melts away as expiration gets closer — and that melting is the seller’s friend.
Directional trading: betting on where
This is the intuitive one, and it’s where almost everyone starts. You have a view on where a stock is headed, and you position for it. The nice thing about being a seller is that you usually don’t need the stock to do anything dramatic — you often just need it to not move sharply against you.
And here’s the useful part: even though it’s a directional bet, you don’t have to be 100% right. By selling further out of the money — a strike set well away from today’s price — you buy yourself a margin for error: unlike swing trading, where the move actually has to happen, the stock can stall or even drift a little against you and you still come out ahead, as long as it doesn’t reach your strike. The catch is that this safety caps your upside at the premium you collected.
Say you sell a put on a company you’d be happy to own, expecting it to hold steady or drift up. Two forces quietly push that option’s price down so you can buy it back for less than you sold it:
- The stock moving in your favor, drifting away from the level that would cause you trouble (your strike price).
- Plain time decay — every day that passes, that time-and-uncertainty slice of the premium shrinks a little, whether the stock moves or not.
Once enough of the premium has drained away, you close the trade early: buy it back cheap, bank most of the profit, and free the capital for the next one. This is both a risk management strategy and an effective way to maximize returns.
How can leaving part of the premium on the table maximize returns? Because of AROI — Annualized Return On Investment. It’s the return on the capital you tied up, stretched out to a yearly rate so you can compare a 5-day trade and a 45-day trade on equal footing. If you’ve already captured 90% of the premium in a quarter of the time, squeezing out the final 10% is slow, low-return money. Buying it back and redeploying that capital into a fresh trade is what actually lifts your annualized return.
This — a directional view, premium collected, closed early — is the bread and butter of the Options Wheel.
Why directional trading is friendlier for beginners
A few honest reasons I’d point every beginner here first:
- You only have to be roughly right about one(ish) thing — the general direction, and often just “not sharply against me.” One variable, not three.
- It maps onto how you already think. Picking a company you believe will hold up is the same instinct you use when you invest normally. Nothing new to learn about how markets move.
- It pairs perfectly with sound risk management. Sell puts on stocks you’d genuinely be happy to own, and direction working out becomes a win either way — you get paid, or you buy a good company at a discount.
- You don’t have to model anything. No estimating volatility, no hedging. One clear thesis, managed simply.
It’s not the most sophisticated approach in the world. It’s just the one most likely to keep a beginner consistent — and consistency is what compounds.
Volatility trading: betting on how much
Now remember the one input nobody can actually know — volatility? That’s the entire game here. Instead of betting on where the market goes, you bet on how much it moves.
To do that, you need to separate two types of volatility:
- Implied Volatility (IV) — the amount of movement the market is expecting, baked into the option’s price right now. High IV means fat, expensive premiums: the market is bracing for a big move.
- Realized Volatility (RV) — how much the stock actually ended up moving once the dust settled.
And here’s the edge: over time, IV tends to run a little higher than what stocks actually realize. Options get priced with a bit of built-in fear, and sellers get paid for absorbing it — a lot like an insurer collecting more in premiums than it pays out in claims. Selling when IV is elevated relative to what’s likely to actually happen is, quietly, the same statistical edge I wrote about in that first post — just seen through a different lens. If you want to go a level deeper on this, tastylive’s free Implied Volatility course is a genuinely good, no-cost place to start.
The purest expression of this is delta-neutral trading: building a position so it barely cares which direction the stock goes, leaving you betting almost entirely on movement versus the volatility you sold. (Delta here just means how sensitive your position is to direction — there’s a whole family of these sensitivities, the Greeks, and I break down all five of them.) Staying neutral means constantly re-balancing as the stock wanders, which is why this is mostly the world of professional traders and market makers. Worth understanding early — not something to attempt in week one.
And one honest thing before we wrap: these two styles aren’t separate universes. When you sell a put on a stock you like and you choose to do it while IV is high, you’re already blending both — directional at heart, with a volatility tailwind at your back. Most of us retail sellers live right in that blend, and it’s a genuinely good place to be.
So which one are you actually doing?
If you’re starting out, the honest answer is: mostly direction — with a quiet volatility edge working in your favour every time you sell rich premium. That’s more than enough to build a real, durable skill on. You don’t need to trade volatility like a market maker to benefit from it; you just need to lean on it sensibly.
Pure volatility trading is a horizon to grow into, not a starting line. It usually leans on a margin account and often involves undefined-risk positions — trades where the potential loss isn’t neatly capped the way a cash-secured put’s is — which is exactly why it isn’t a beginner’s game. Learn to read IV, get comfortable with the mechanics, sell when premiums are generous — and that deeper world opens up on its own, in its own time.
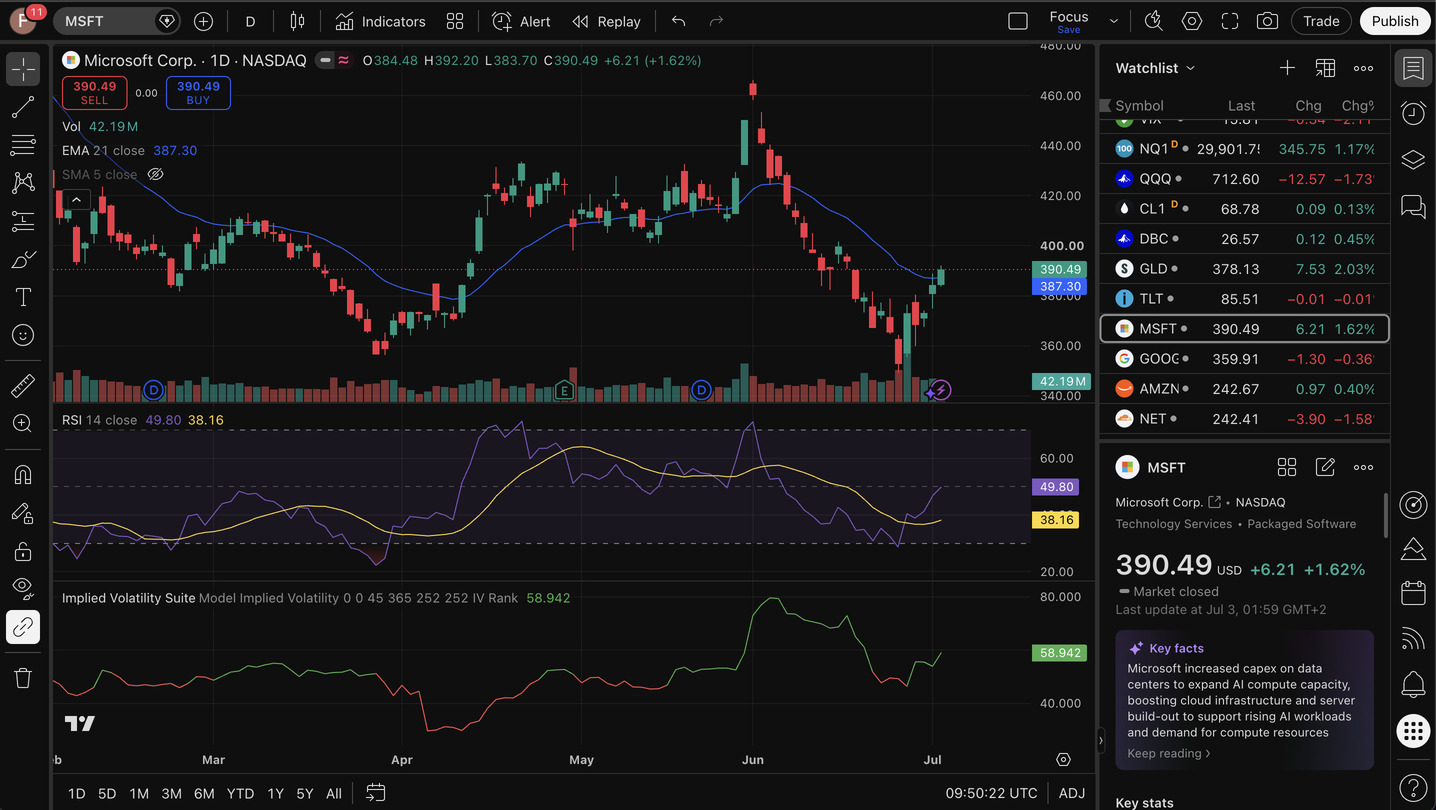
And if you learn best by doing — I do — the easiest place to start is TradingView: add the free Implied Volatility Suite indicator to any chart and just play with it. Watch how IV ramps up into earnings and deflates right after, or spikes on a scary day and settles on a quiet one. It’s a low-stakes way to get a feel for how volatility actually behaves before you ever put money behind it. And if you’d rather work the other direction — start from a real option price and back out the volatility the market is implying — you can do exactly that in our implied volatility calculator, watching every Greek shift as you change the inputs.
Trade Well,
Francesco
Software Developer & Options Trader
Creator of Ctrl-Trade. A software developer of 15+ years who brings a programmer’s discipline — clear rules, data and backtesting — to options trading, and writes about what he learns in plain English.